

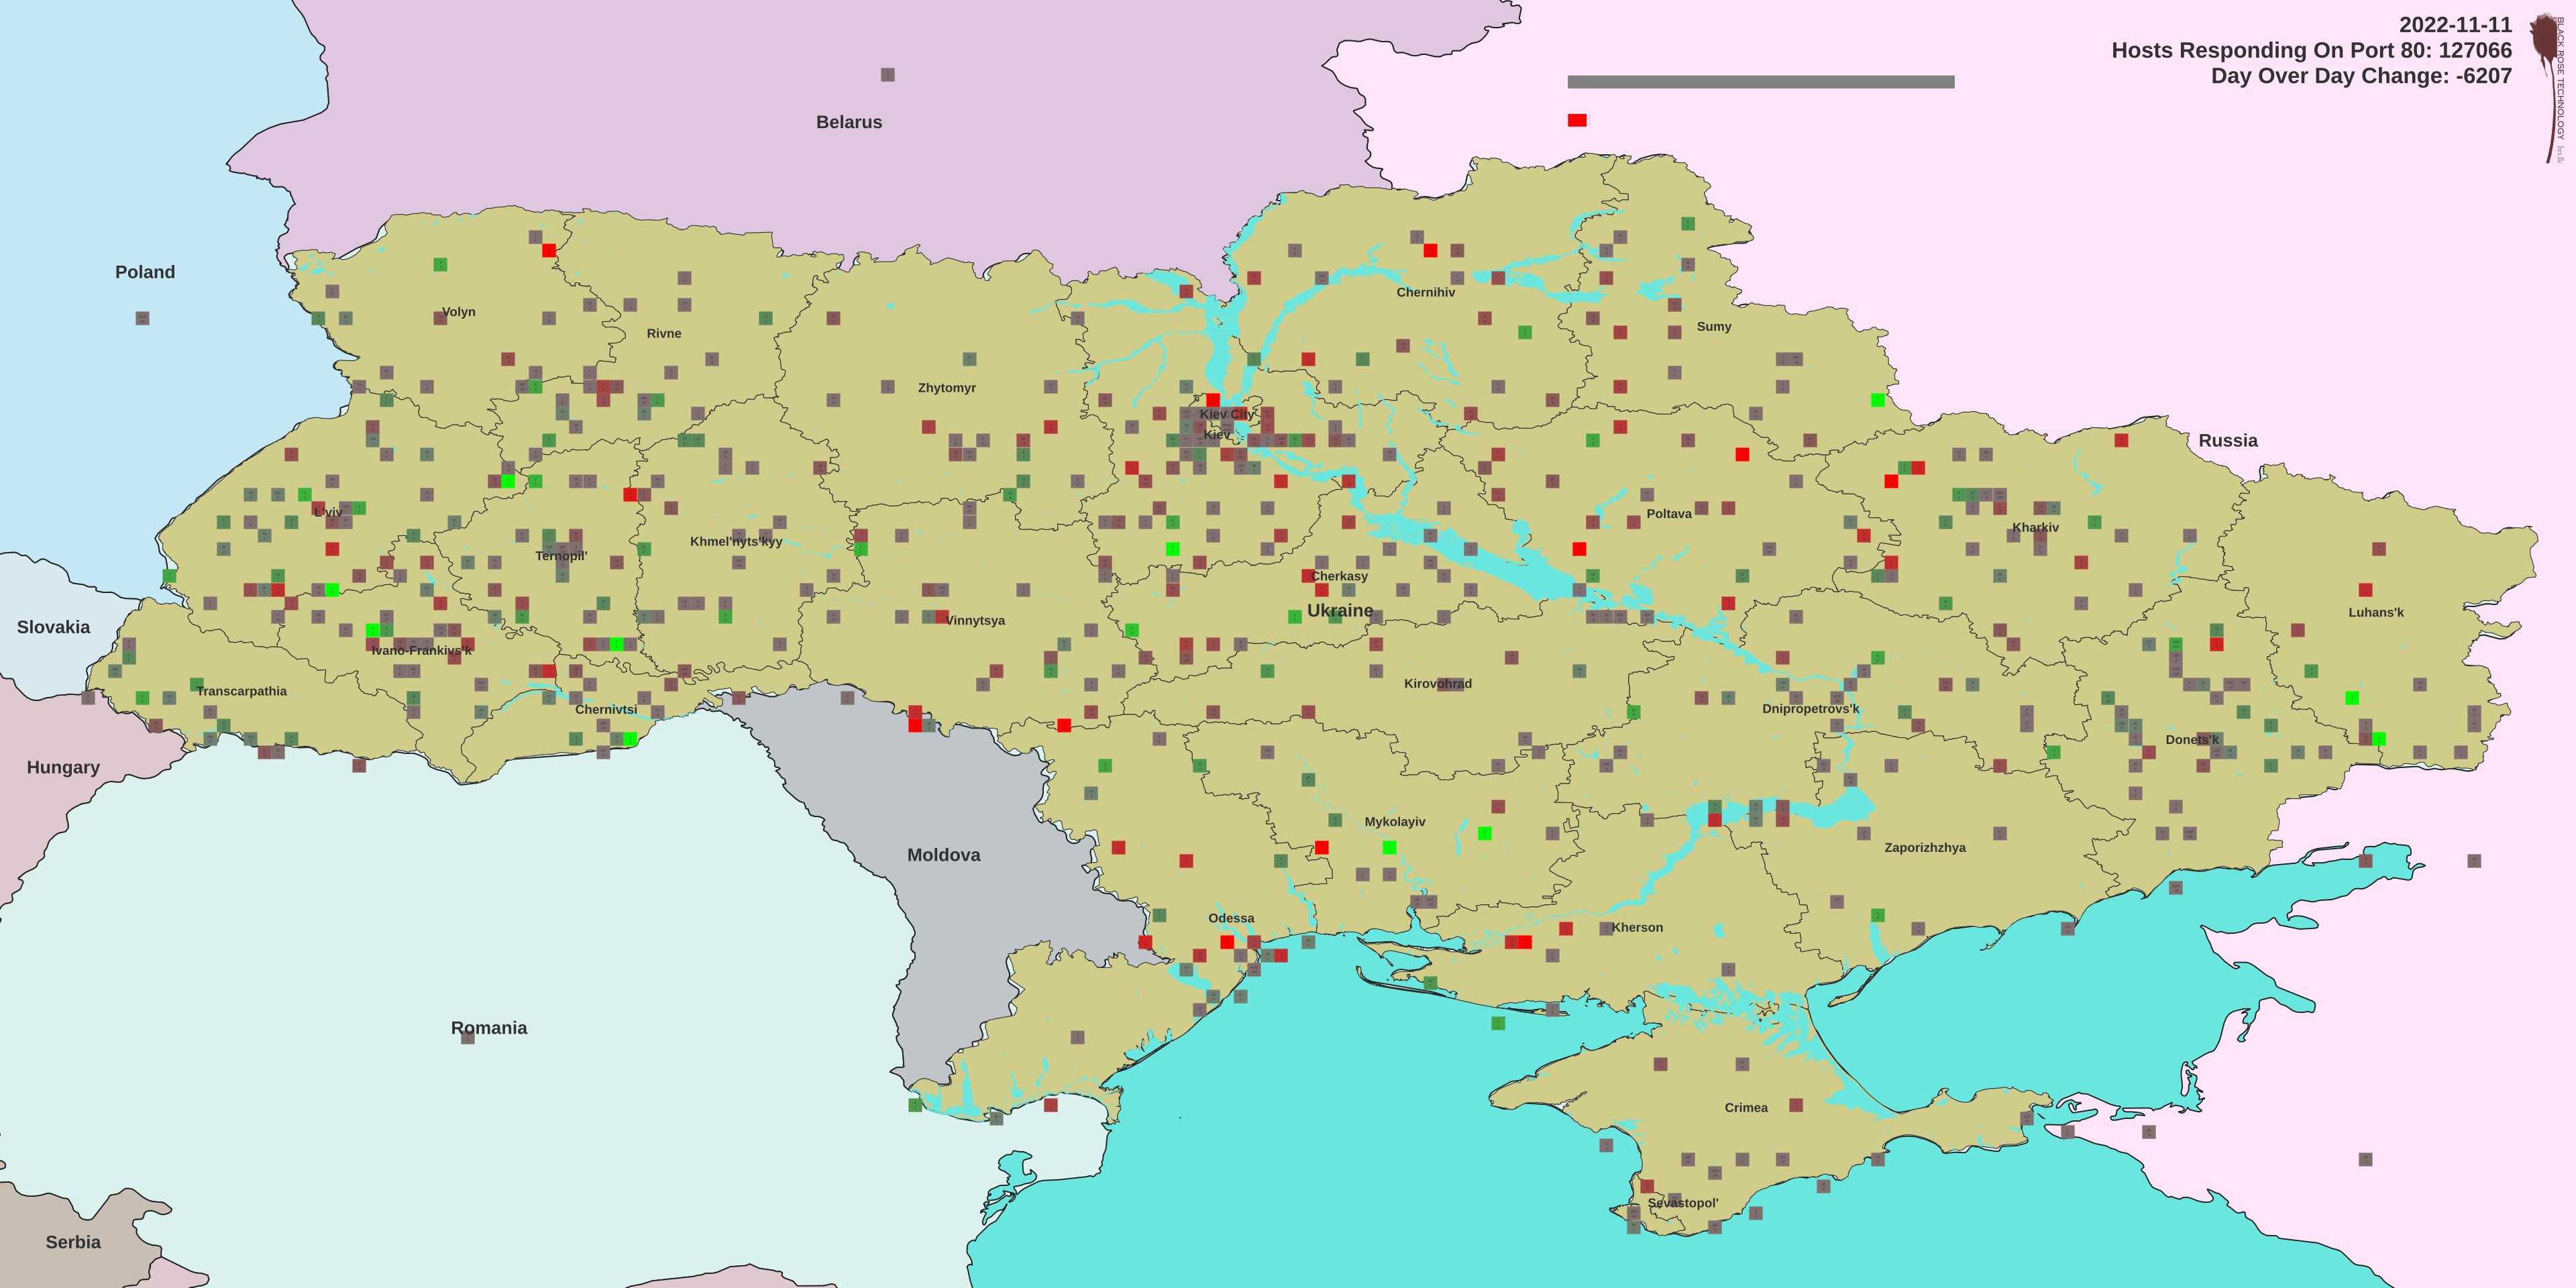
We started a project to monitor the entire Ukranian IP space, some 11,295,373 IP addresses every night checking port 80 at each IP using zmap, which generally returns about 130,000 hits.
Summary data is updated daily at https://brt.llc/ukrainian-server-survey-updated-daily/
Each of these are then processed using a local instance of the Maxmind GeoIP database and a modified version of Brady Shea’s script to build a CSV file that includes the latitude, longitude, city, and ASN of each IP.
These files are too large to process without rather a lot of RAM and the zmap data is rather noisy, so additional, internally developed code, aggregates the data into 0.1 degree square blocks and reformats into a daily database of about 612 data rows consisting of Lat, Lon, Count, dominant city and count in that city, dominant ASN and count in that ASN.
The daily data is further processed to compute the day-over-day differences which are then mapped in QGIS over time using temporal mapping.
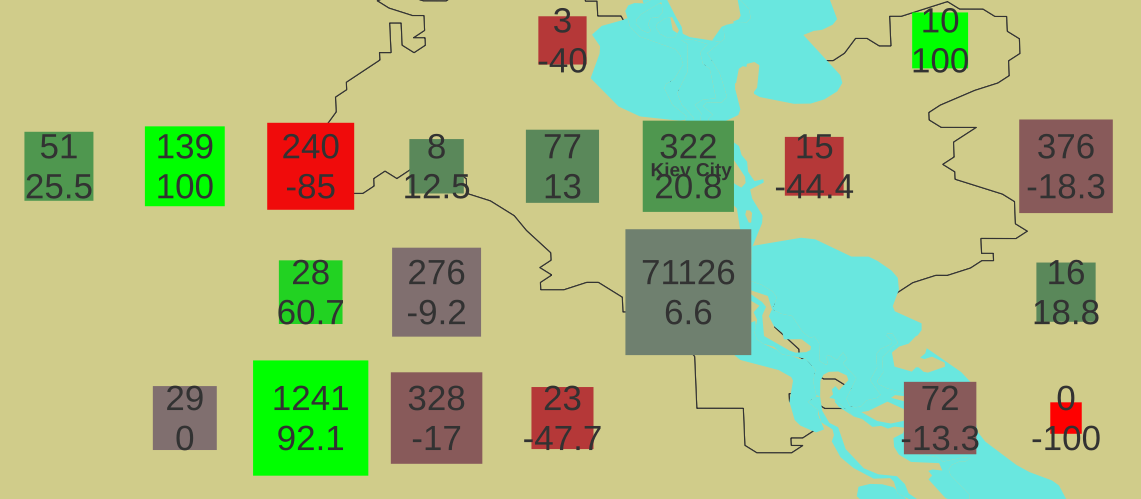
The size of the symbols range from 0.025 degrees square to 0.1 degrees square driven by the total number of servers responding in the geographic block, scaled exponentially to emphasize numerical variation in the small end of the scale. One might interpret larger squares as having more statistically significant data regarding the state of the digital infrastructure in the geographic region represented.
The color of each block is determined by the percentage change in the server count day-over-day from red, representing -100% meaning all servers in the block were lost to green, representing +100% meaning a the block went from 0 servers responding to some number larger than 0 in one day. This color coding is expected to illuminate localized changes in the state of the Ukrainian digital infrastructure.
The premise is that the server responses act as proxy sensors for the combination of power availability (such that the servers are on) and network availability (such that the servers are remotely accessible). If either fails, the server can’t respond, which is a proxy for the state of the regional digital infrastructure.
We find both national-scale and regional scale events, but overall the total number of servers responding has remained fairly constant, even from regions understood to be under Russian control. It is likely that ISPs were rerouted, thus to some extent confounding GeoIP lookup and to some degree degrading the validity of the data as a geographic reference. In future conflicts we will explicitly track such mitigations by trace-routing the path from the “sensor” to the first hop out of country to look for ASN-scale rerouting effects.
Pending further analysis, HTML-interactive maps of specific dates will be published as well as updates of the animated sequence of all data days.
Note that glitches in monitoring system connectivity resulted in some artifacts, such as the atypically high counts on 2022-05-06 and -07, which were collected during the daytime rather than overnight; it seems 20-30% of servers are turned off at night.
Additionally, from 2022-09-09 to -16, no data was collected so the last good data is repeated. It is very unlikely that this period had no variation in response at all, but skipping the days would create a discontinuity in the temporal mapping functions.
The below video shows data collected from 2022-03-05 to 2022-11-11. The video resolution is 3840×1920 so optimal readability requires a 4k+ monitor. The expand button will generally result in full-screen playback.
Data collection is ongoing.