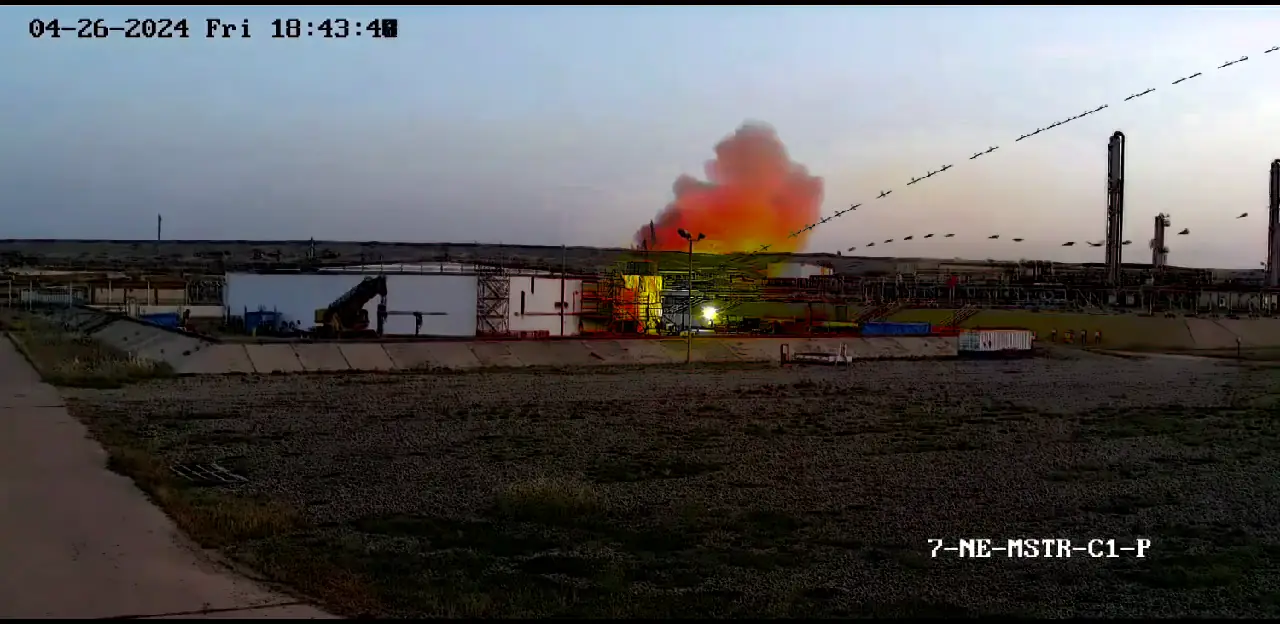
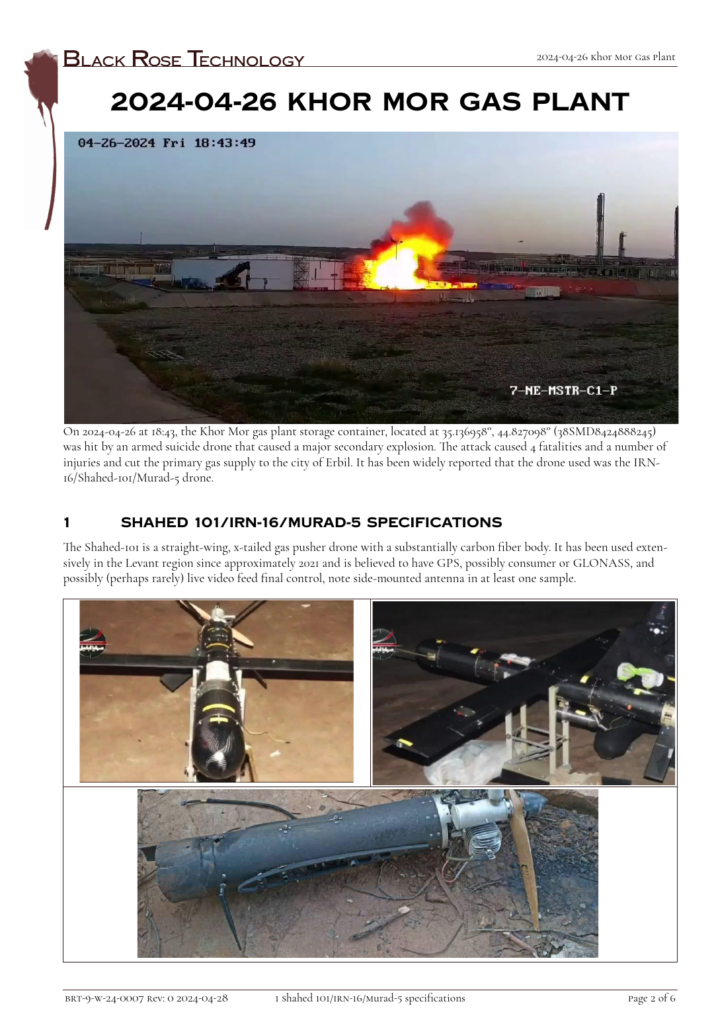
On 2024-04-26 at 18:43, the Khor Mor gas plant storage container, located at 35.136958°, 44.827098° (38SMD8424888245) was hit by an armed suicide drone that caused a major secondary explosion. The attack caused 4 fatalities and a number of injuries and cut the primary gas supply to the city of Erbil. It has been widely reported that the drone used was the IRN- 16/Shahed-101/Murad-5 drone.
A good quality CCTV video feed of the day-time incident permitted atypically precise analysis of the drone’s flight path, from which we can estimate the drone’s approach velocity fairly with reasonable precision as 44.7 m/sec or 160 km/h.
The Khor Mor attack demonstrates the vulnerability of critical infrastructure to attack by low cost drones. The cost-benefit for an antagonist of deploying low-cost weapons with extremely low risk of loss of operators makes such attacks extremely attractive to NSAIG world-wide, and successes such as this will drive further use. A cost-effective, symmetric countermeasure to reduce the success rate of such attacks is increasingly essential for the protection of critical infrastructure.
Further details and the analysis process are covered in the linked pdf.
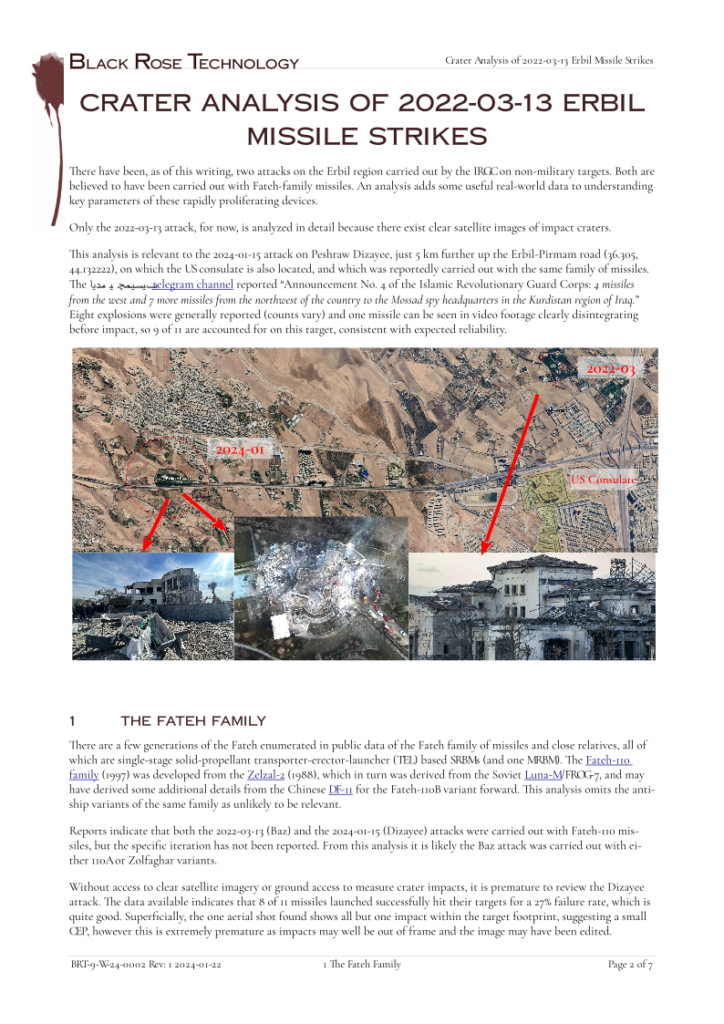
There have been, as of this writing, two missile attacks on Erbil region targets reported to have been carried out with Fateh-family missiles. While there is yet to be clear public-domain imagery of the most recent attack made available, there is clear data of the 2022-03-13 attack.
An analysis of those images adds some useful real-world data to understanding key parameters of these rapidly proliferating devices.
This analysis is relevant to the 2024-01-15 attack on a building reported as the residence of Peshraw Dizayee, which has been reported as carried out with the same family of missiles. While we are unable to add much insight to that latest attack pending the publication of high resolution satellite images, we were able to derive some estimated performance parameters of the devices used in the earlier strike on a target reported as the residence of Sheikh Baz.
We introduce a modified version of the standard equation for predicting apparent crater radius based on explosive parameters to solve for specific explosive mass from measured apparent crater radius.
Black Rose Technology has long understood the cyberthreat presented by compromised and backdoored IoT devices and digital infrastructure and has only ever offered equipment from what are now classified as NDAA compliant sources. Black Rose Technology does not work with low-end, low-cost camera systems and has historically found that European and North American suppliers have consistently provided the highest quality, best performing CCTV cameras on the market that give customers the best overall value even before considering the investment such vendors consistently make in ensuring devices are secure against against even state-sponsored attacks.
The NDAA Section 889 and recently enacted FCC 22-84 rules are complicated and compliance with them is almost certainly company and funding specific. While we cannot act as a substitute for a compliance officer to ensure current and ongoing NDAA or FCC compliance, it is straightforward to avoid complications by insisting on NDAA/FCC compliant cameras and active network components across any organization’s network. We believe it is both more cost efficient in the long run and more secure to proactively comply with the letter and intent of the NDAA and FCC prohibitions by qualifying only known good vendors of secure, compliant equipment rather than attempting to find short term savings in equipment of dubious provenance.
It is often argued that NDAA compliance concerns and the funding and the federal funding regulations around them are more political than practical; while that may be true to some extent there are legitimate security concerns that underlie the United States federal government and allied countries’ drive to remove active network elements of concern from all critical infrastructure. All organizations should consider the risks of non-compliance both practical, regulatory, and reputational. An area of specific concern is for companies that receive federal funding or do business with the US government that compliance is proactive and complete and anticipates predictable future legislation given evolving recognition of the threat posed by cyber-compromise, especially in an era of renewed great power competition.
Black Rose Technology limits sales to FCC and NDAA compliant hardware as part of our commitment to ensuring the security, stability, and compliance of our customers’ networks. We know that the digital environment has become an active battle space in great power conflict and will increasingly become a critical vulnerability for defense against both state and non-state actors who are actively developing sophisticated attack stratagems as part of rapidly expanding cyberwarfare military focus. While no system can be completely secure and, indeed, all Turing-complete computers are provably insecure, following best practices both maximizes security and minimizes liability for any compromise. Any entity concerned about digital security or the consequences of an unintended compromise is well-served by ensuring compliance with best practices. Black Rose Technology is committed to supporting our customers, maintaining and protecting their digital networks from cyber attacks, and preventing them from being exploited as footholds in large scale digital conflicts.
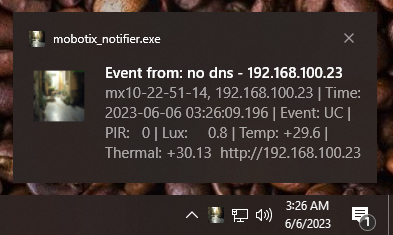
We have developed a small python application for internal use to enable desktop notifications of camera events using Mobotix’ “IP Notify” action capability as a sender and our python script as a receiver so that the camera can push notifications to the OS desktop notification system. The script is extremely resource light and can be run at startup in the background without measurable impact on the OS.
For details on the application and download, please see visit this link. The script is available for download as python code with installation instructions that has been tested on Linux and Windows and should run without issue on MacOS, but has not been tested in that environment. There is also an installable Windows binary (.exe) available with all necessary dependencies integrated for those unfamiliar with command line operations.
The software is provided “as is”, without warranty of any kind, express or implied, including but not limited to the warranties of merchantability, fitness for a particular purpose and noninfringement. In no event shall the copyright holders or anyone distributing the software be liable for any damages or other liability, whether in contract, tort or otherwise, arising from, out of or in connection with the software or the use of the software.
Our daily survey of all of the IP’s geolocated in Ukraine for those responding on port 80 is now available on a special page that is updated daily. While we still create chloropleth sector maps manually following sigacts, the summary data including the latest server count, difference, an updated graph in SVG format, and some additional statistical analysis is now available at this URL:
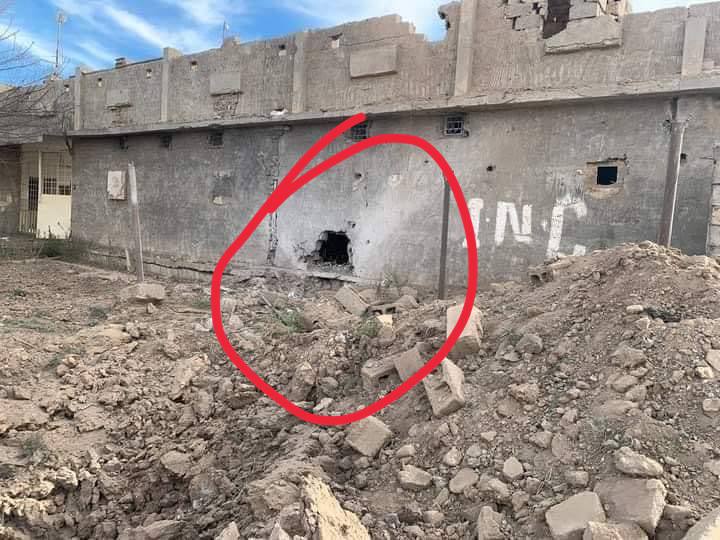
On the night of 2022-11-21, shortly after midnight, two synchronized attacks on reported PJAK (PDKI) facilities in Jazhnikan/Jejnikan (جەژنیکان) (near Erbil, verified PoI 36.342596° N, 44.006713° E) and Koya (کۆیە) (reported PoI 36.064012° N, 44.604222° E) were reported by the media and on twitter.
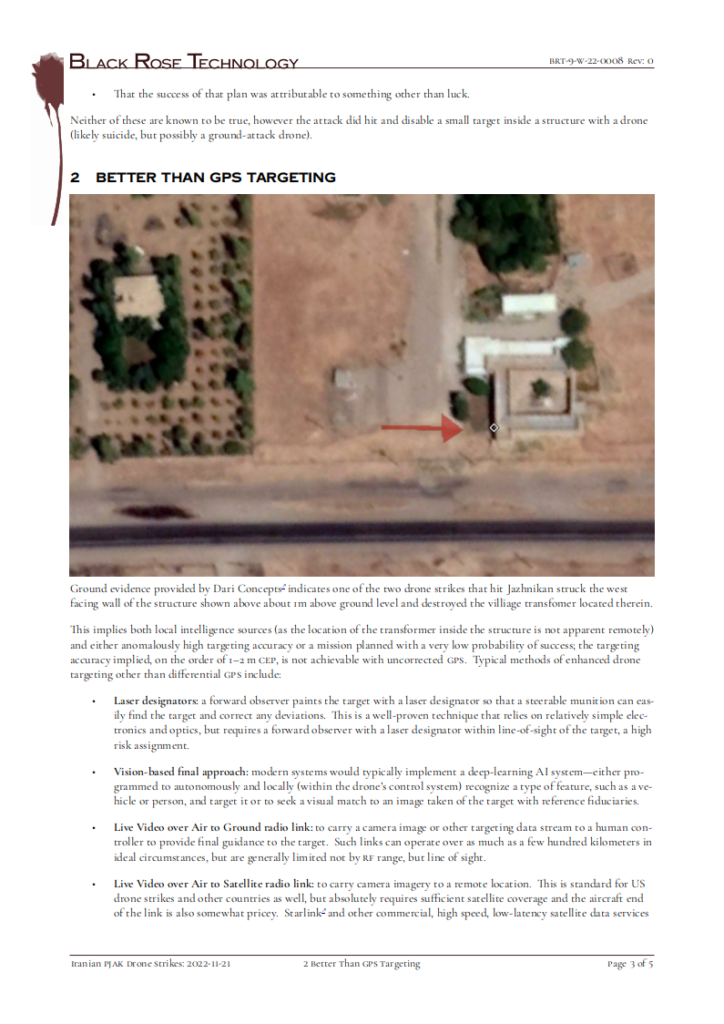
Reports indicate the target of the Jazhnikan attack was the village transformer which was stored inside a building and not visible from the air or the street. Accepting these reports as representative of mission intent, the necessary targeting accuracy (1–2 m CEP) is meaningfully higher than civilian GPS-based targeting is reliably capable of.
Attacks with suicide drones are a growing threat globally and represent a significant escalation of asymmetry through technology. Novel threats such as drone attacks can be significantly re-symmetrized though integrated deployment of novel countermeasures like ESR radar optimized for drone detection, such as the Echodyne Echoguard products.
Our observations have shown ongoing impact on UKR digital infrastructure. While most events are quickly resolved, there continues to be a strong correlation between attacks and downtime. The last week has shown some significant and sustained losses of server availability in the UKR, consistent with reports of sustained assaults on UKR critical infrastructure.
Over the monitoring period (2022-03-05 to present), the median number of servers online is 121,317 with a standard deviation of 14,201 or 11.7% of that standard deviation. In the first few months of the conflict, significant deviations from the median were fairly rare and recovery tended to be rapid. In the recent round of attacks, connectivity losses have been more frequent and sustained.
UKR nationwide responding servers and day-over-day changes.
(The up spike on 2022-05-06 and downspike on 2022-05-08 are due to date collection timing anomalies)
A summary of significant activity shows the nadir of server response to date was 2022-08-22 when two days of significant losses left only 72,071 servers responding. Despite an increased tempo of infrastructure attacks, server response recovery remains strong.
The below table shows dates of significant losses as the percentage of servers live and the day-over-day loss relative to median.
Date
Live
Change
2022-04-13
73.5%
-24.1%
2022-06-03
73.8%
-26.1%
2022-06-15
77.3%
-22.0%
2022-08-21
67.7%
-36.0%
2022-08-22
59.4%
-8.3%
2022-09-28
62.8%
-44.1%
2022-10-04
73.0%
-23.1%
2022-10-22
89.2%
-23.2%
2022-11-04
69.3%
-38.6%
2022-11-16
61.8%
-51.8%
2022-11-24
75.6%
-29.4%
UKR Server Connectivity Significant Activity
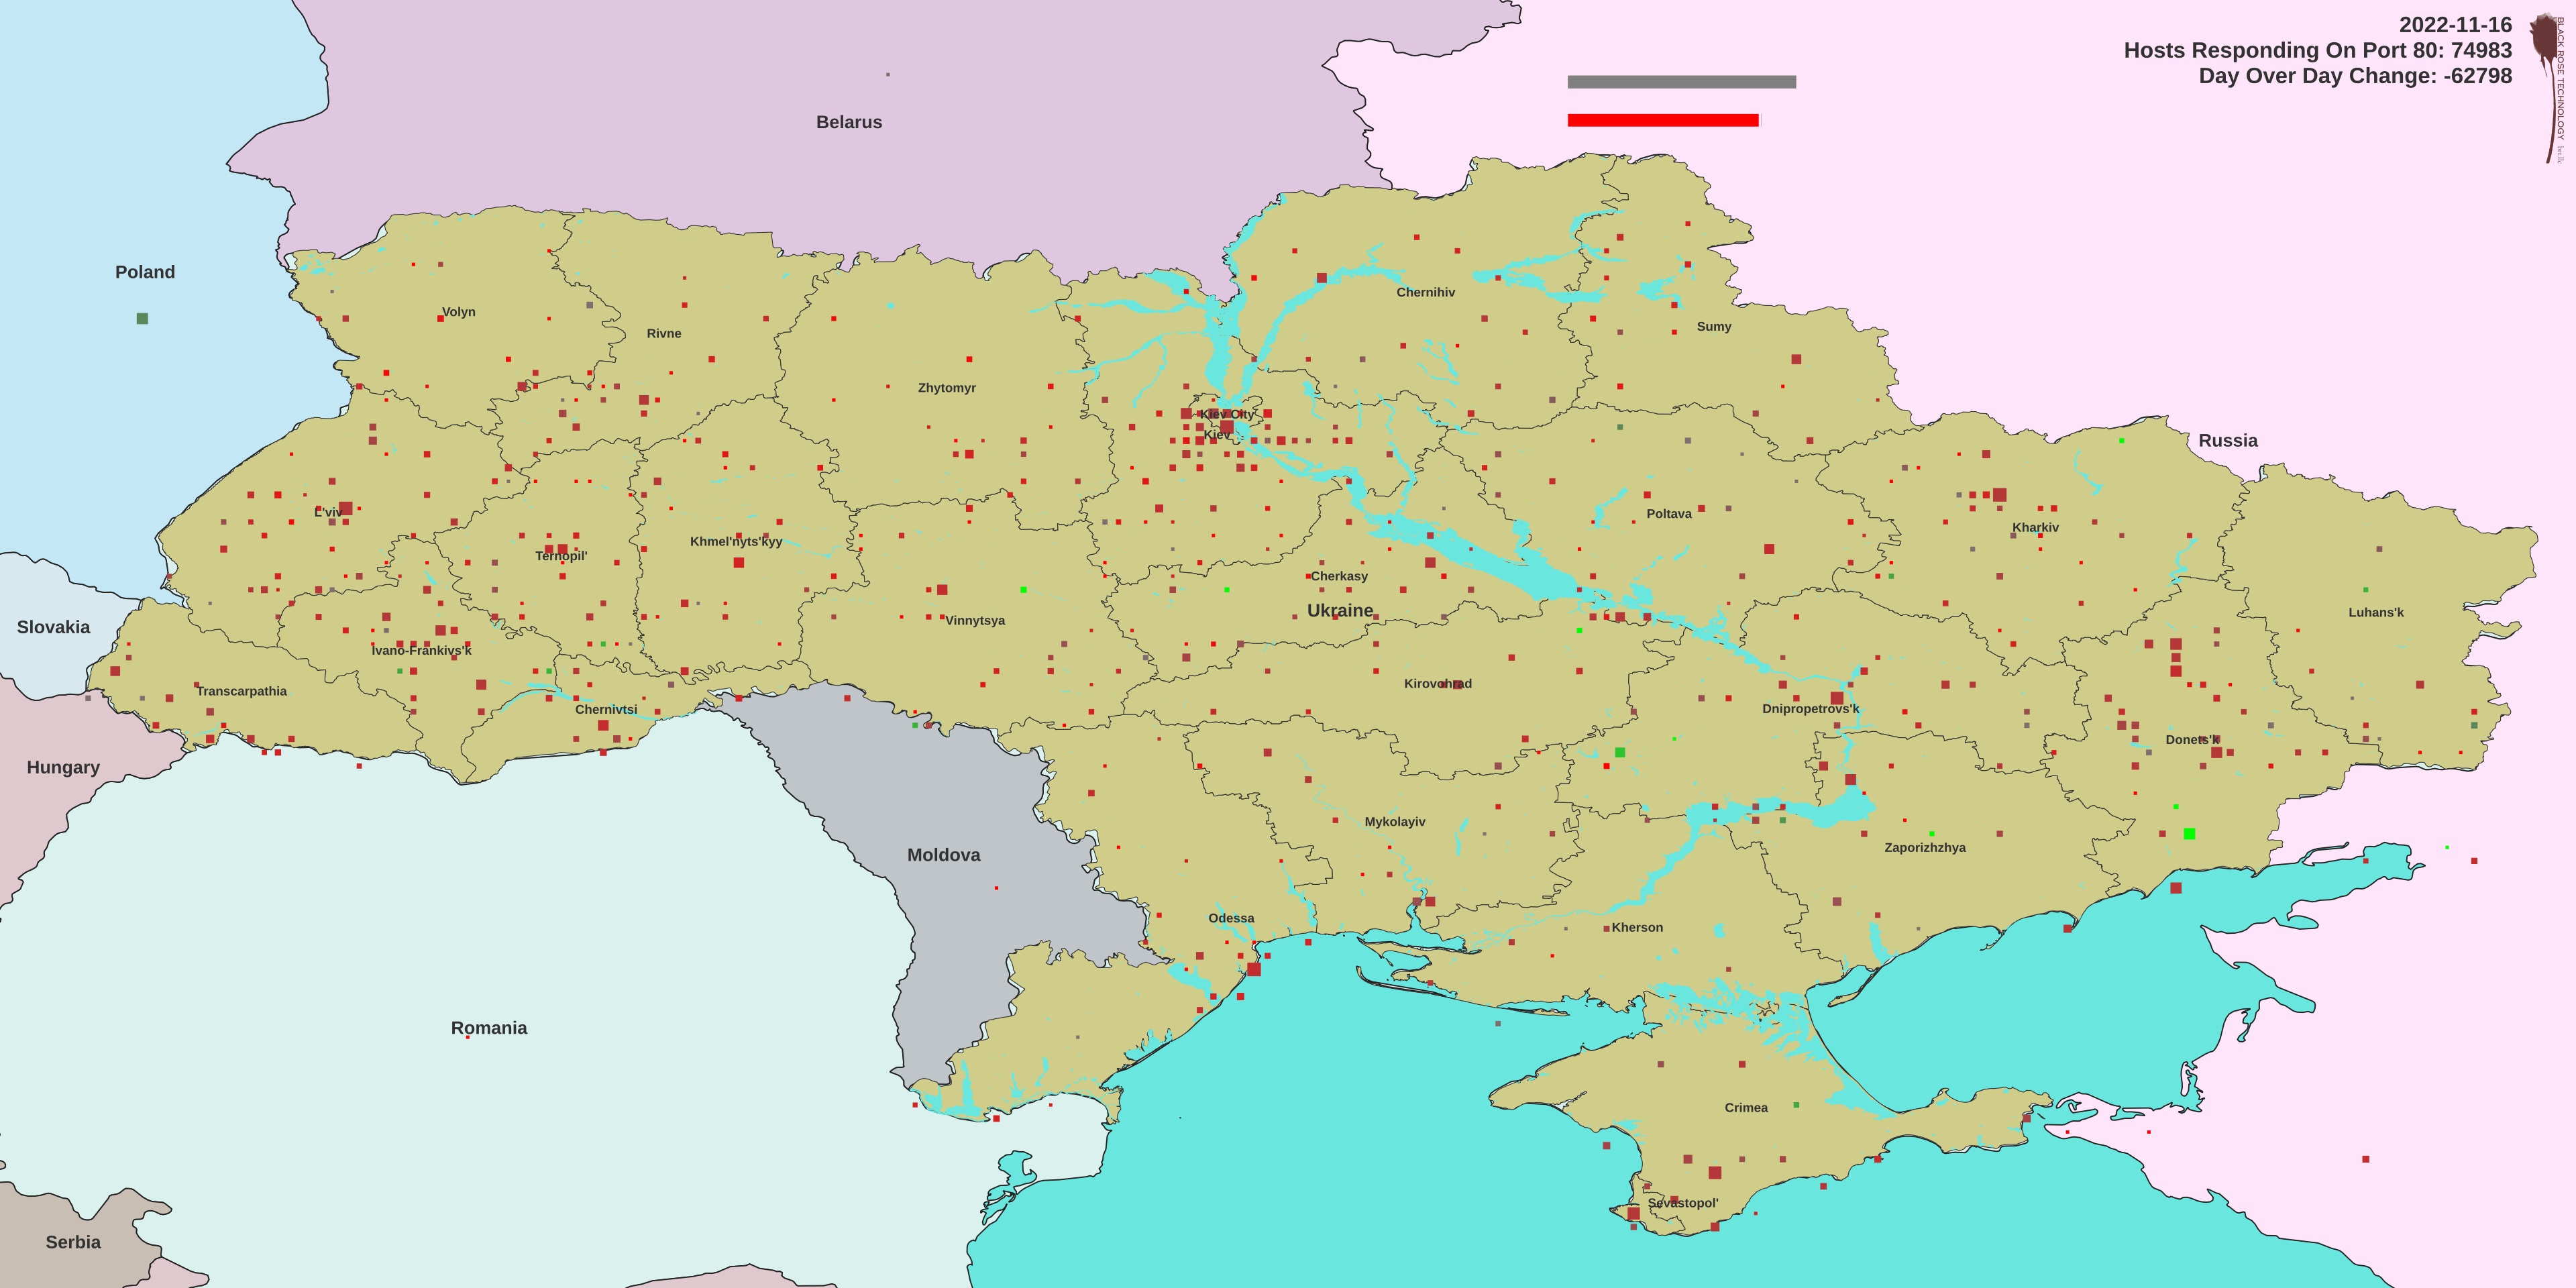
The most significant single day change to date was detected on 2022-11-16 following the 2022-11-15 missile campaign, which knocked out almost half of all servers (and more than half relative to median).
Losses have generally exceeded recovery such that total server responses are trending below median, 2022-11-24 also representing a one-day loss of almost 3⨉ the standard deviation.
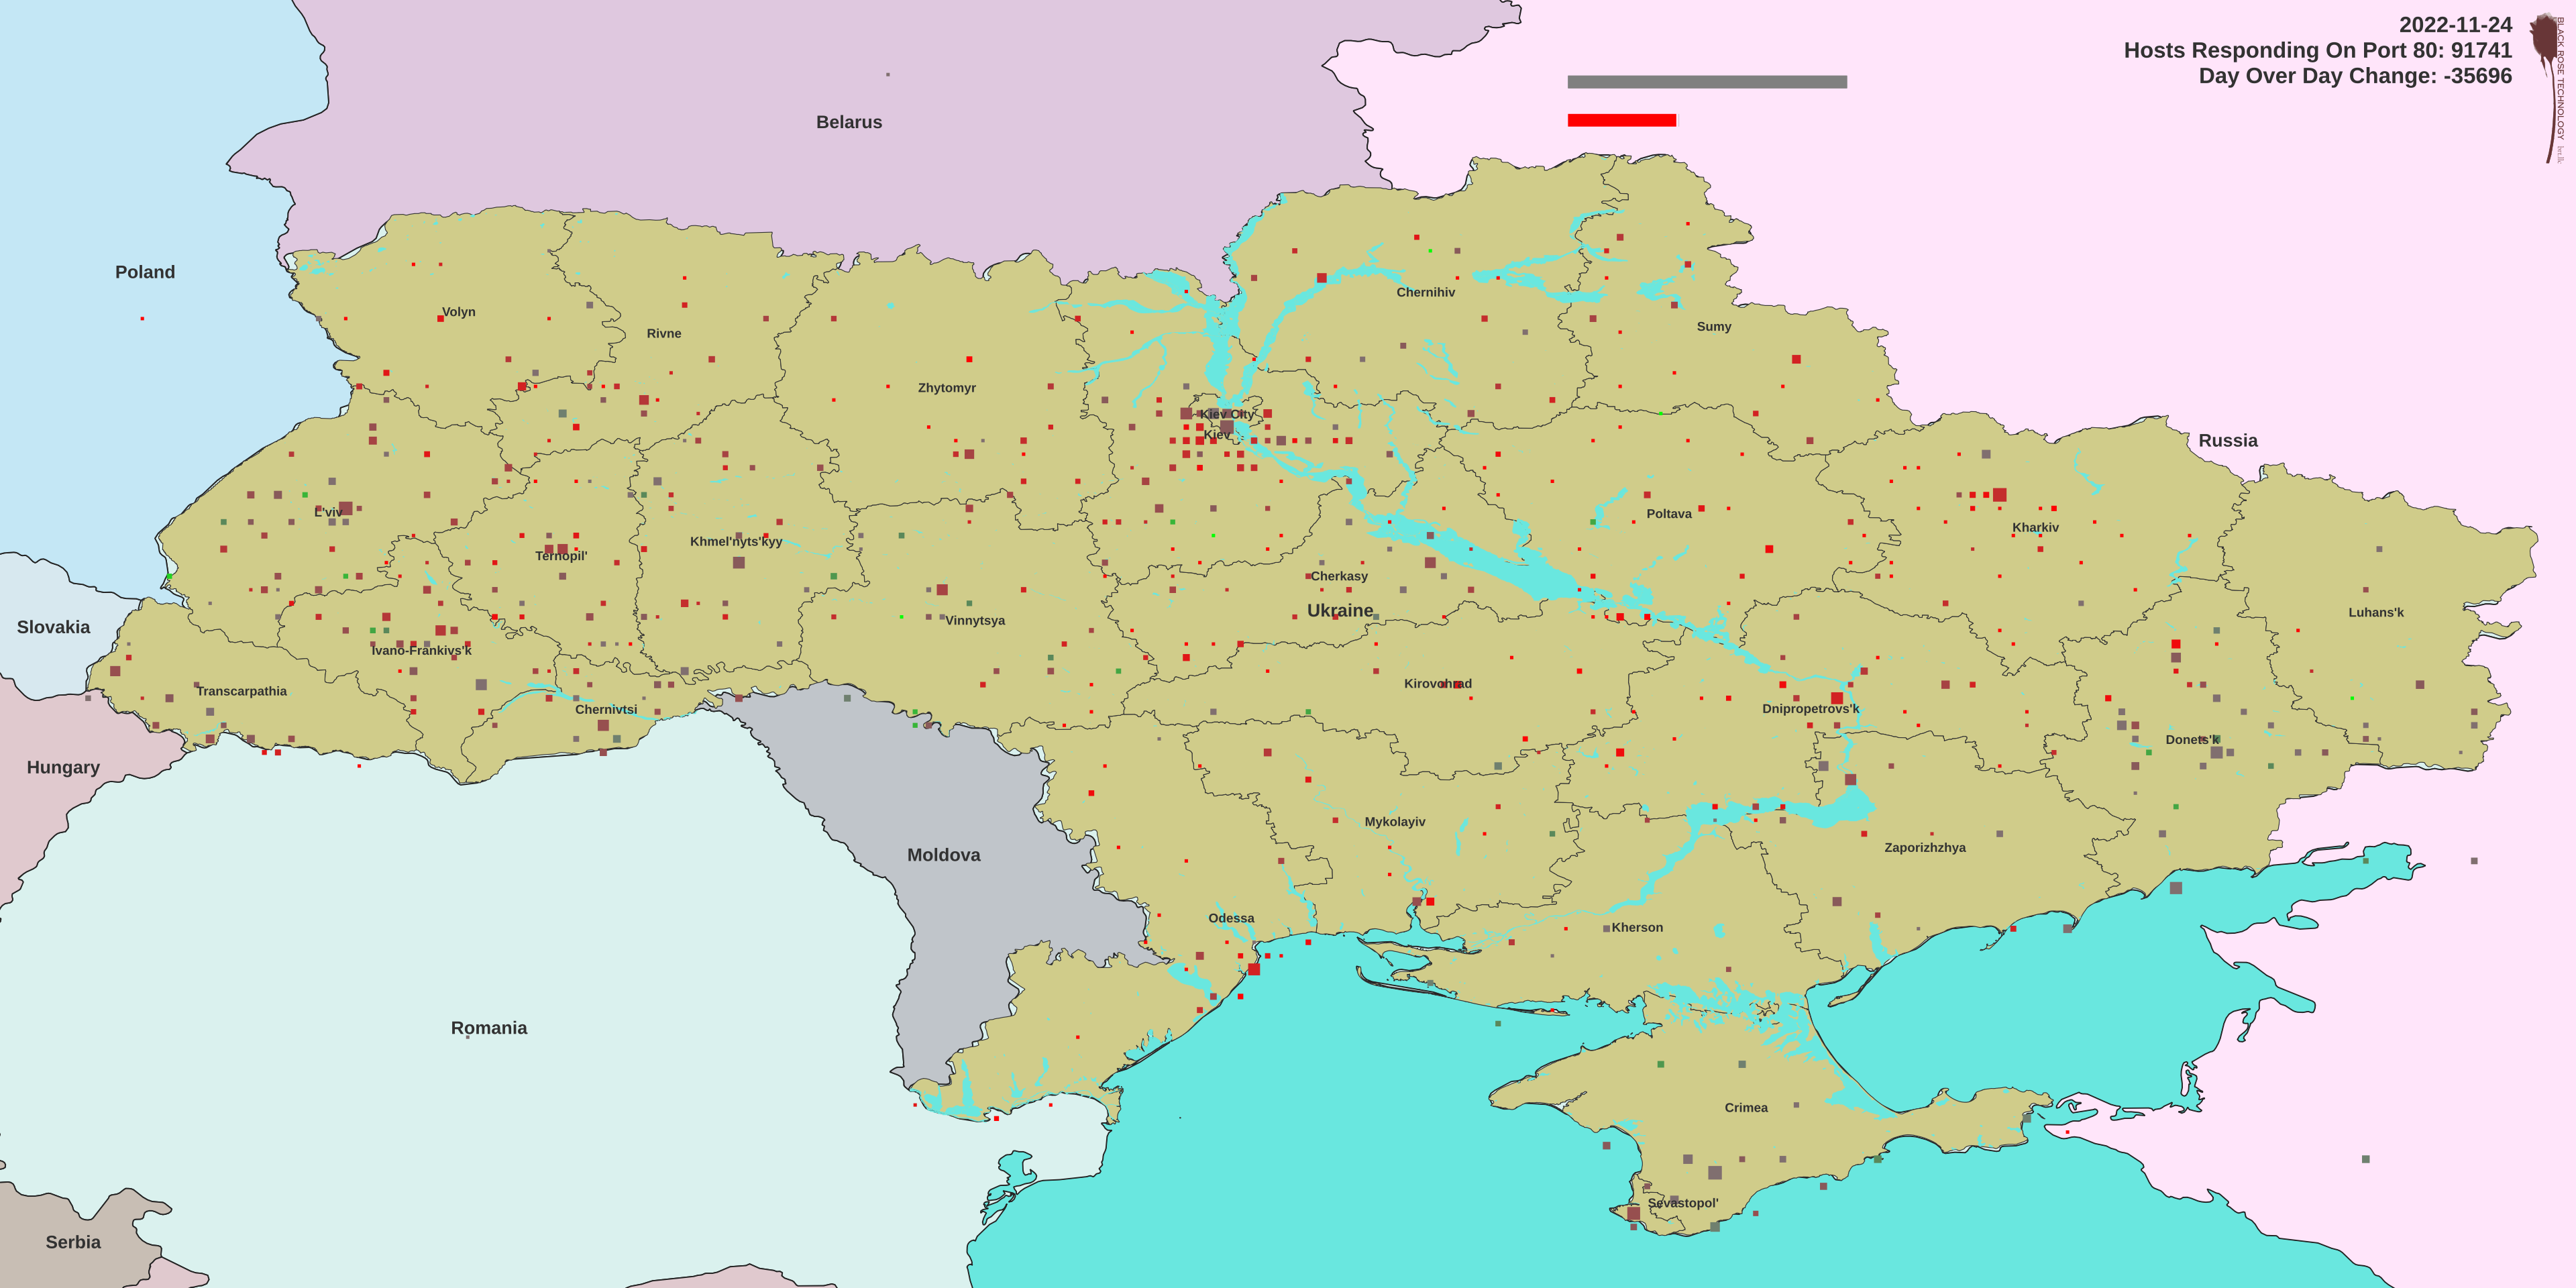
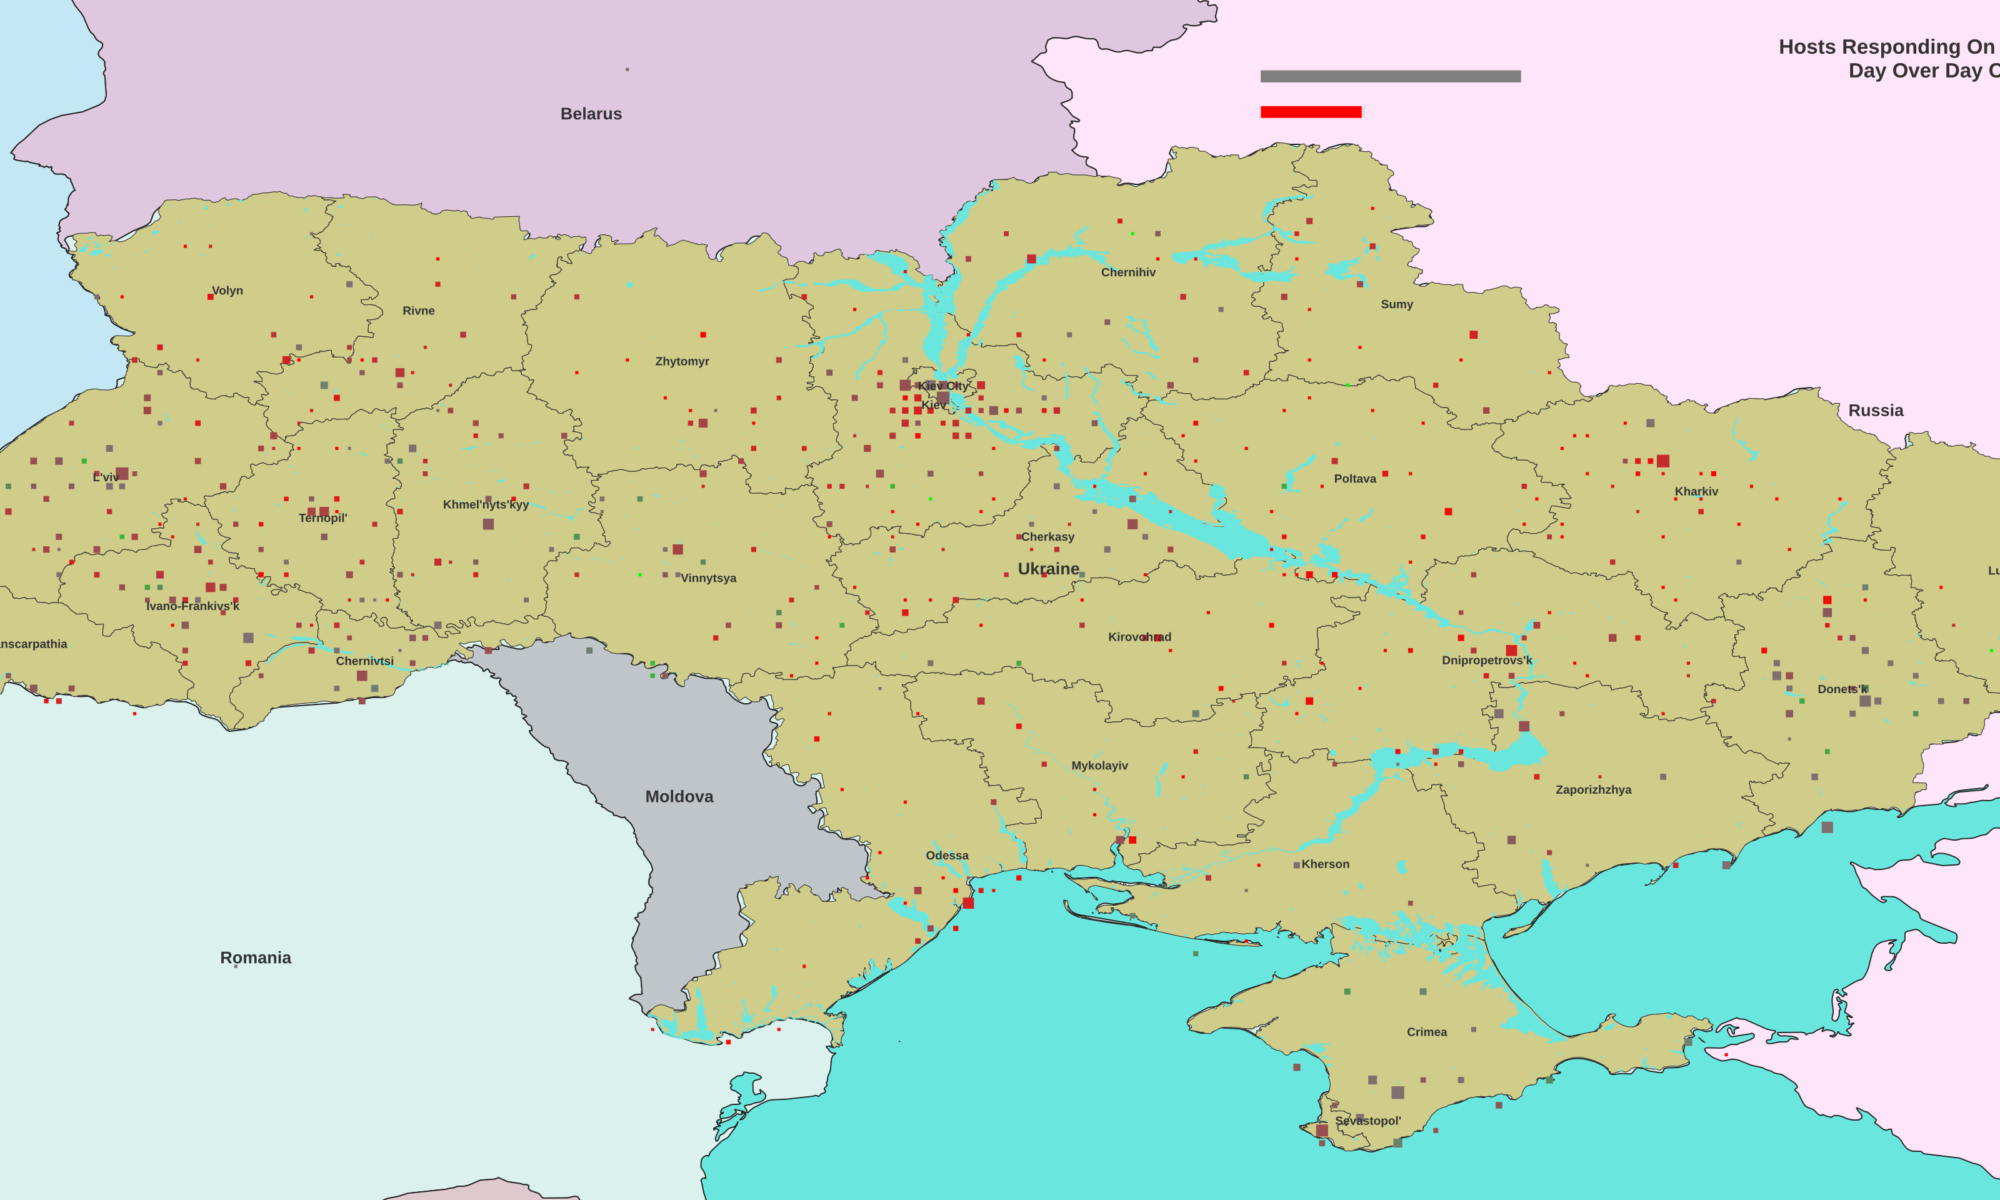
UKR Server Response Map 2022-11-24
A video (3840×1980 resolution, expand on a 4k screen for maximum readability) shows the reported data over the sampling period to 2022-11-27.
Our network server sensor system detected the largest loss of servers we’ve seen yet: 62,798 servers going offline, or 45.6% of the country’s total detected server infrastructure.
Russian fourth wave: 45.6% of Ukrainian servers offline.
The third wave of this series of missile attacks (31 October) had a moderate impact by typical daily norms, though a small fraction of the impact of the Oct 22ⁿᵈ & especially Nov 15ᵗʰ attacks with 6,007 servers going offline. Reporting indicates this wave mostly targeted Kiev, and while the Kiev region hosts most of the country’s detected servers, the limited scope of the attack seems to be reflected in the measured data.
Russian third wave: 4.3% of Ukrainian servers offline.
The second wave (21–22 October) of attacks caused significant outages as measured by our monitoring with 28,175 servers going offline, substantially higher than expected indicating a major event. The measured results appear to be consistent with reporting on the impact to the energy infrastructure.
Russian second wave: 20.6% of Ukrainian servers offline.
The first wave, (10–12 October}, did not seem to cause a statistically significant impact on the Ukrainian server infrastructure with only 1,739 servers going offline, despite being reported as wide-spread. The temporal distribution of the attack likely enabled ongoing service restoration, reducing the detectable impact. The cumulative toll on the infrastructure may also contribute to later waves yield more significant impacts on the national digital infrastructure.
Russian first wave: 1.4% of Ukrainian servers offline.
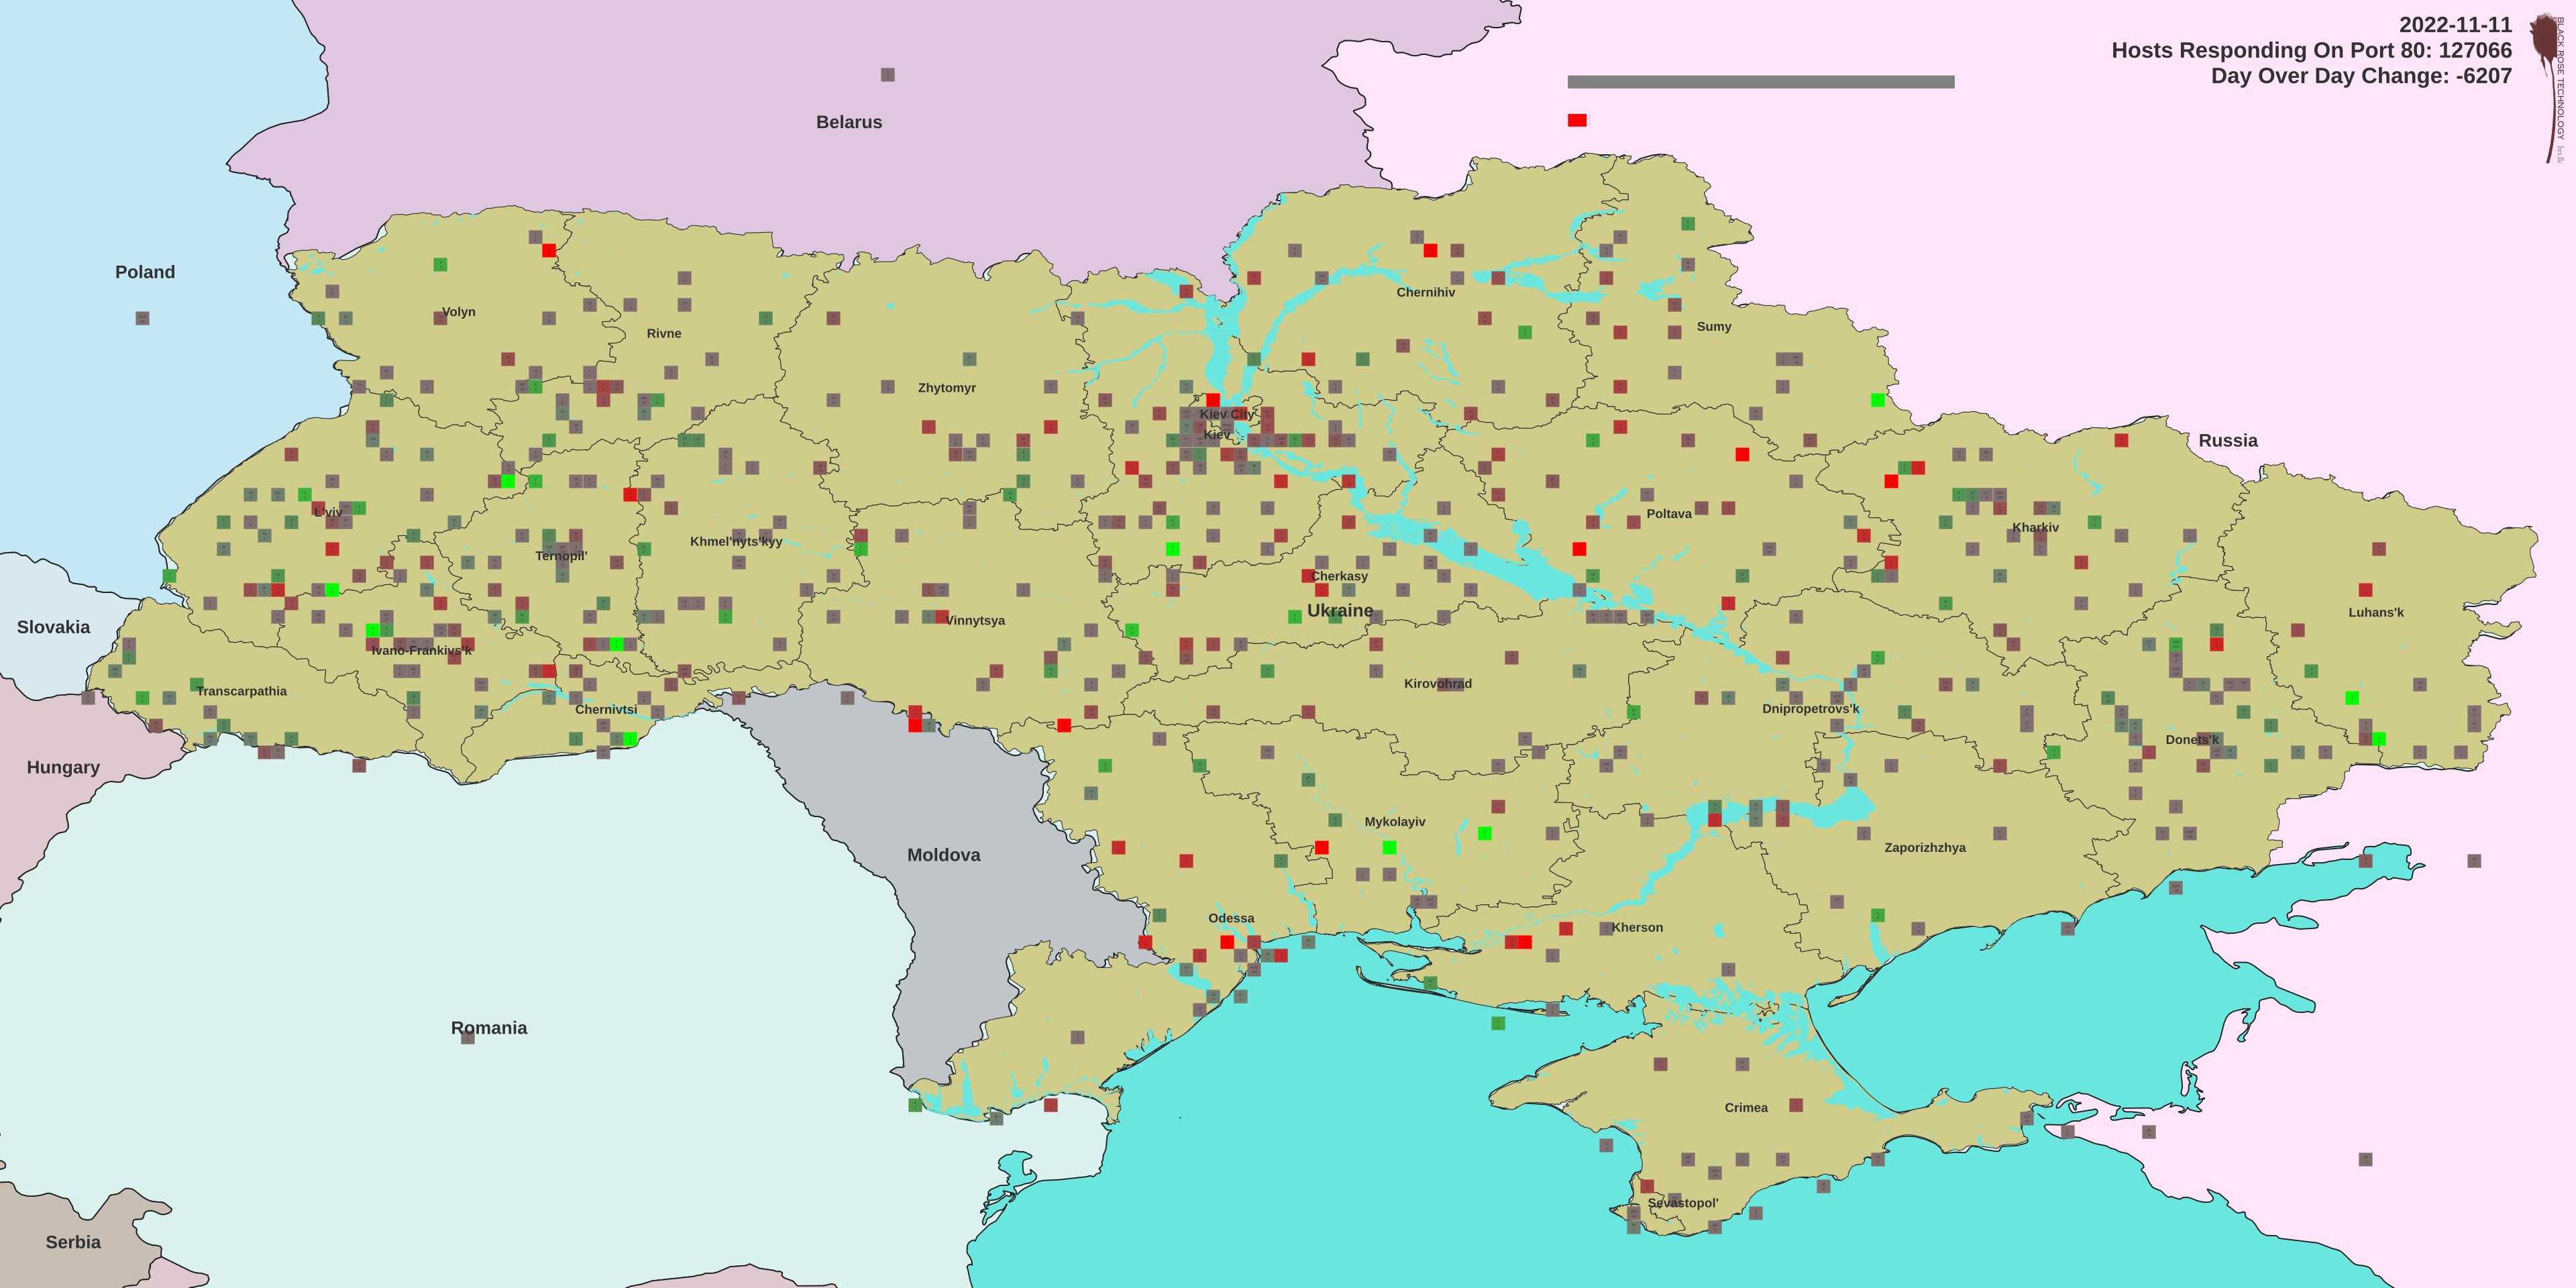
We started a project to monitor the entire Ukranian IP space, some 11,295,373 IP addresses every night checking port 80 at each IP using zmap, which generally returns about 130,000 hits.
Servers Responding on Port 80 in Ukraine on 2022-11-11
Each of these are then processed using a local instance of the Maxmind GeoIP database and a modified version of Brady Shea’s script to build a CSV file that includes the latitude, longitude, city, and ASN of each IP.
These files are too large to process without rather a lot of RAM and the zmap data is rather noisy, so additional, internally developed code, aggregates the data into 0.1 degree square blocks and reformats into a daily database of about 612 data rows consisting of Lat, Lon, Count, dominant city and count in that city, dominant ASN and count in that ASN.
The daily data is further processed to compute the day-over-day differences which are then mapped in QGIS over time using temporal mapping.
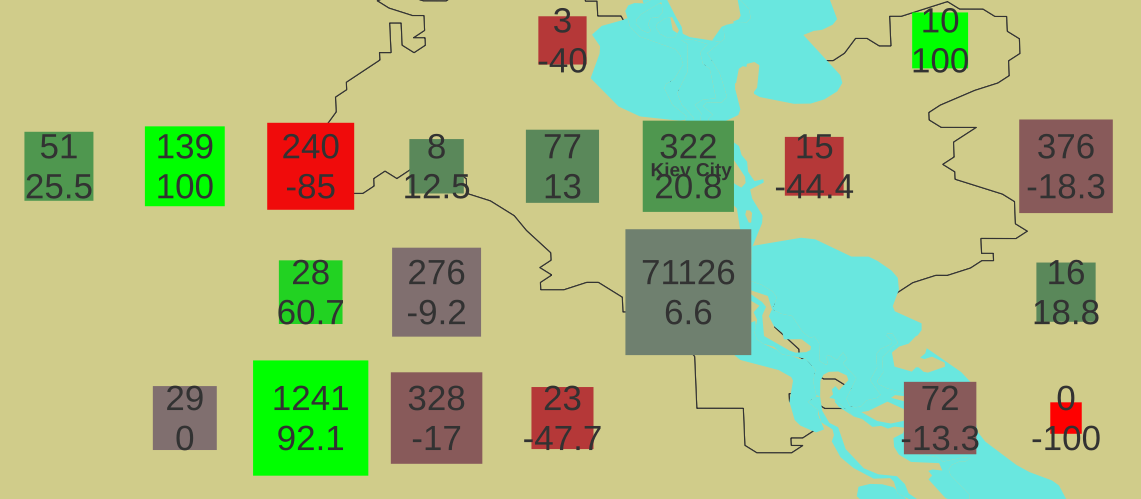
The size of the symbols range from 0.025 degrees square to 0.1 degrees square driven by the total number of servers responding in the geographic block, scaled exponentially to emphasize numerical variation in the small end of the scale. One might interpret larger squares as having more statistically significant data regarding the state of the digital infrastructure in the geographic region represented.
The color of each block is determined by the percentage change in the server count day-over-day from red, representing -100% meaning all servers in the block were lost to green, representing +100% meaning a the block went from 0 servers responding to some number larger than 0 in one day. This color coding is expected to illuminate localized changes in the state of the Ukrainian digital infrastructure.
Map symbol details
The premise is that the server responses act as proxy sensors for the combination of power availability (such that the servers are on) and network availability (such that the servers are remotely accessible). If either fails, the server can’t respond, which is a proxy for the state of the regional digital infrastructure.
We find both national-scale and regional scale events, but overall the total number of servers responding has remained fairly constant, even from regions understood to be under Russian control. It is likely that ISPs were rerouted, thus to some extent confounding GeoIP lookup and to some degree degrading the validity of the data as a geographic reference. In future conflicts we will explicitly track such mitigations by trace-routing the path from the “sensor” to the first hop out of country to look for ASN-scale rerouting effects.
Pending further analysis, HTML-interactive maps of specific dates will be published as well as updates of the animated sequence of all data days.
Note that glitches in monitoring system connectivity resulted in some artifacts, such as the atypically high counts on 2022-05-06 and -07, which were collected during the daytime rather than overnight; it seems 20-30% of servers are turned off at night.
Additionally, from 2022-09-09 to -16, no data was collected so the last good data is repeated. It is very unlikely that this period had no variation in response at all, but skipping the days would create a discontinuity in the temporal mapping functions.
The below video shows data collected from 2022-03-05 to 2022-11-11. The video resolution is 3840×1920 so optimal readability requires a 4k+ monitor. The expand button will generally result in full-screen playback.
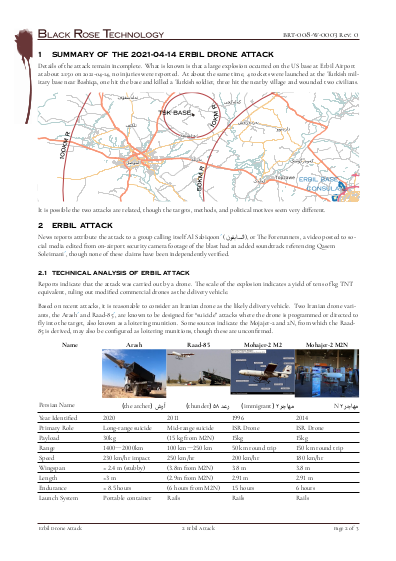
On 14 April, the US base at the Erbil Airport was hit by an attack widely reported as a drone attack. The explosion was substantial, meaningfully louder than the 15 February 107mm rocket attacks. While circumstantial, the evidence suggests a far heavier payload than modified consumer drones can carry and almost certainly implies the use of military drone technology of Iranian origin.
Attacks with suicide drones are new to the KRG region and represent a significant escalation of asymmetry through technology. Novel threats such as drone attacks can be significantly mitigated though integrated deployment of novel countermeasures, such as ESR radar optimized for drone detection, such as the Echodyne Echoguard products.